- Cheap train tickets
- Season tickets
- Smart tickets
- Ticket types
- Tap2Go pay as you go travel
- Railcards and discount cards
- How to buy train tickets
- Family train tickets
- Combined ferry, hovercraft and train tickets
- Price promise
- Business Direct
- Flexi Season ticket
- Weekly season ticket
- Monthly season ticket
- Monthly auto renewal season ticket
- Monthly plus season ticket
- Annual season ticket
- Advance tickets
- Anytime tickets
- Off-Peak tickets
- GroupSave train tickets
- Group Travel train tickets
- Evening Out tickets
- Sunday Out tickets
- Super Off-Peak tickets
- Semi Flex Return tickets
- London Travelcards
- Test
- Test
- 16-17 Saver Railcard
- 16-25 Student Railcard
- 26-30 Railcard
- Two Together Railcard
- Disabled Persons Railcard
- Family and Friends Railcard
- HM Forces Railcard
- Veterans Railcard
- Network Railcard
- Senior Railcard
- Test
- Test
- Test
- Test
- Test
- Test
- Test
- Test
- Train times
- Download SWR timetables
- Changes to your journey
- How busy is my train?
- Live times and updates
- Planned improvements
- Summer events
- Mobile app
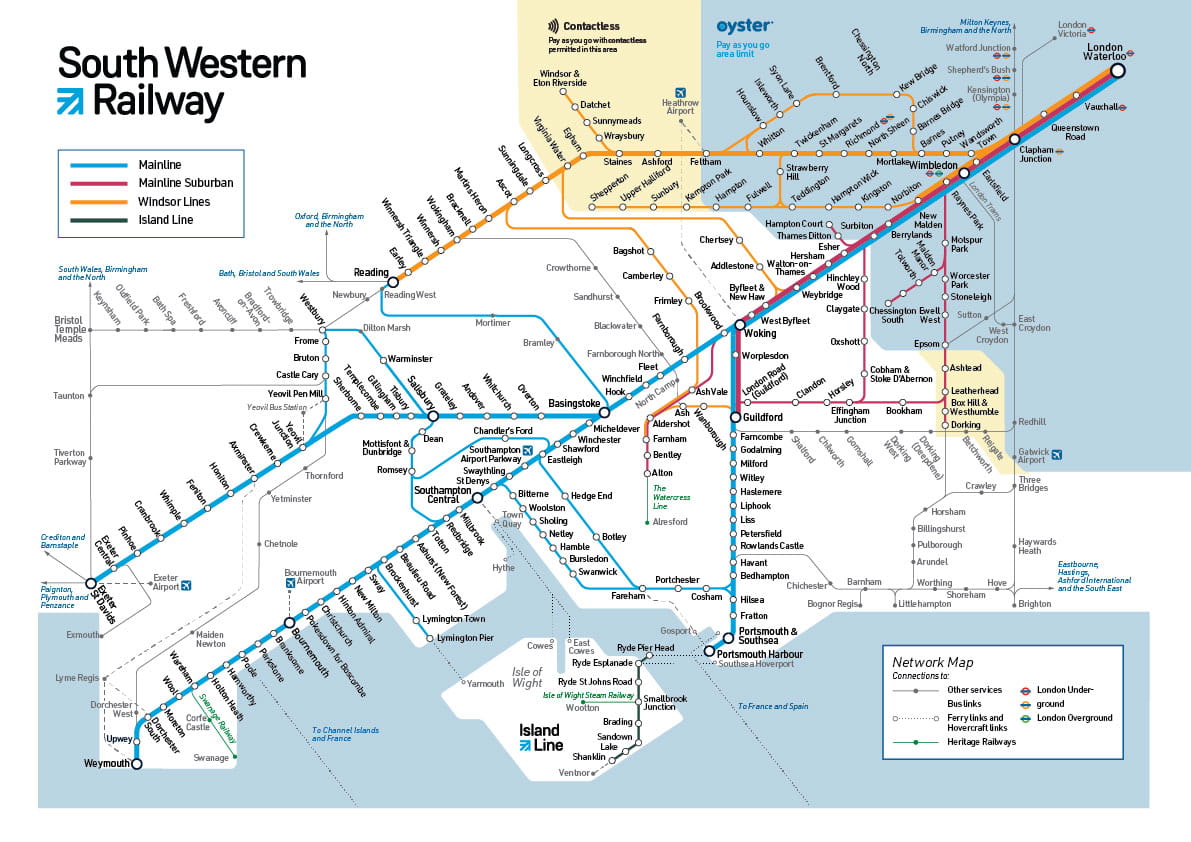
- Network map
- Test
- Test
- Test
- Test
- Test
- Test
- Test
- Test
- Test
- Test
- Planned engineering calendar
- Rail Replacement Bus Stops
- Engineering work weekly summary
- June/July engineering work
- August engineering work
- September engineering work
- Test
- Test
- Test
- Test
- Test
- Test
- Our train stations
- Our trains
- On board facilities
- Assisted travel
- Travelling with a bike
- Travelling with kids
- Travelling with pets
- Hot weather
- Soil moisture deficit
- Customer Experience
- Ticket checks and revenue protection
- Staying safe
- Performance
- Car parking
- Onward travel
- Bus links
- PlusBus
- Berrylands station upgrade
- Southampton Central lift refurbishment
- InPost parcel lockers
- Free Wi-Fi at our stations
- Airport links
- Arterio
- Class 158 "Express Sprinter"
- Class 159 "South Western Turbo"
- Class 444 "Desiro"
- Class 450 "Desiro"
- Class 455
- Class 458/4
- Class 484
- Assisted Boarding Points
- Accessibility
- Assistance dogs
- BSL
- Discounted fares
- Sunflower lanyards
- Toilets
- Wheelchairs, scooters and ramps
- Travel Assistance Card
- Test
- Test
- Test
- Test
- Test
- Test
- Test
- Test
- Test
- Test
- Test
- Test
- Test
- Safeguarding
- 2for1 offers
- Destinations
- Where Next travel blog
- Sights and attractions
- SWR Rewards
- Competitions
- 2FOR1 deals and 1/3 OFF savings
- Offers
- Island Line
- Heritage railways
- Test
- Test
- Test
- Test
- Test
- Test
- Test
- Test
- Test
- Test
- Test
- Test
- Contact us
- Delay Repay
- Refunds and compensation
- Cancelled trains
- Changing your train tickets
- Making a claim after disruption
- Lost property
- FAQs
- Website and app FAQs
- Smartcard help and support
- Make a complaint
- Test
- Test
- Test
- Test
- Test
- Test
- Test
- Test
- Test
- Test
- Test
- Test
- Test
- Test
- Test
- Test
- Test
- Test
- Test
- Test
- Test
- Test