At South Western Railway we know that you want a safe, reliable, punctual service. We’re committed to providing this, to help deliver the best service we can.
We continually measure our service reliability and punctuality and report on how we are performing against targets which are set in our Passenger’s Charter.
All our services are monitored every day, including Sundays and Bank Holidays and we have a range of performance activities taking place to improve our network. Here are a few things we are doing this year:
- Continuing to rollout the Arterio trains to replace the suburban fleet.
- £129m investment in the re-signalling from Farncombe to Petersfield, including the renewal of nine level crossings.
- Queenstown Road Track Renewal to remove multiple reoccurring faults in the area.
Want to know more about what we're doing to improve performance?
Download our Joint Performance Strategy with Network Rail, delivering a high performing railway, together.
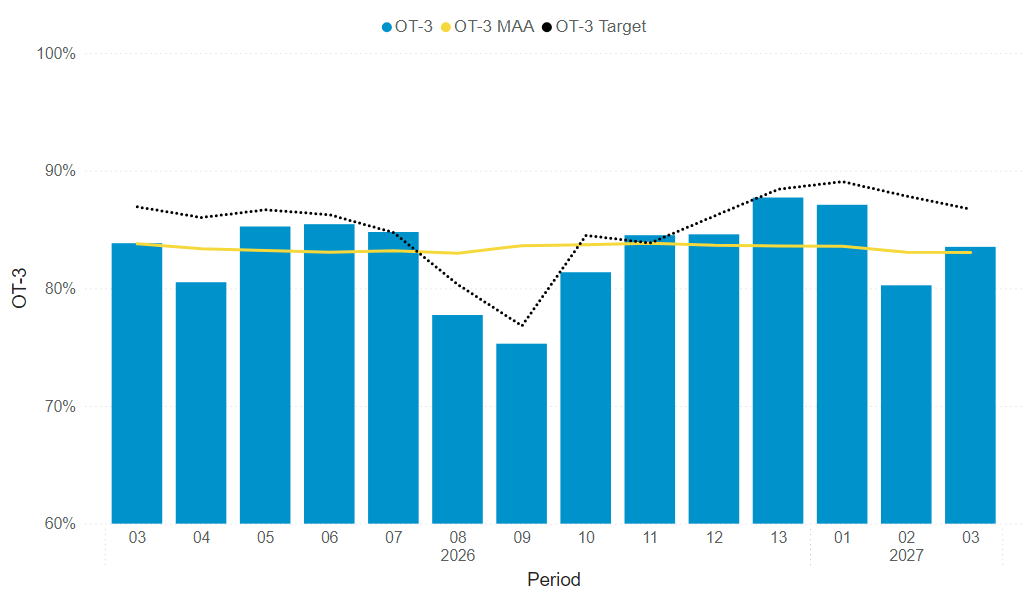
Headline Performance data — Period 3 (31 May - 27 June)
The rail year runs from 1st April to 31st March and is split up into 13 four-week ‘periods'.
Percentage of total services cancelled
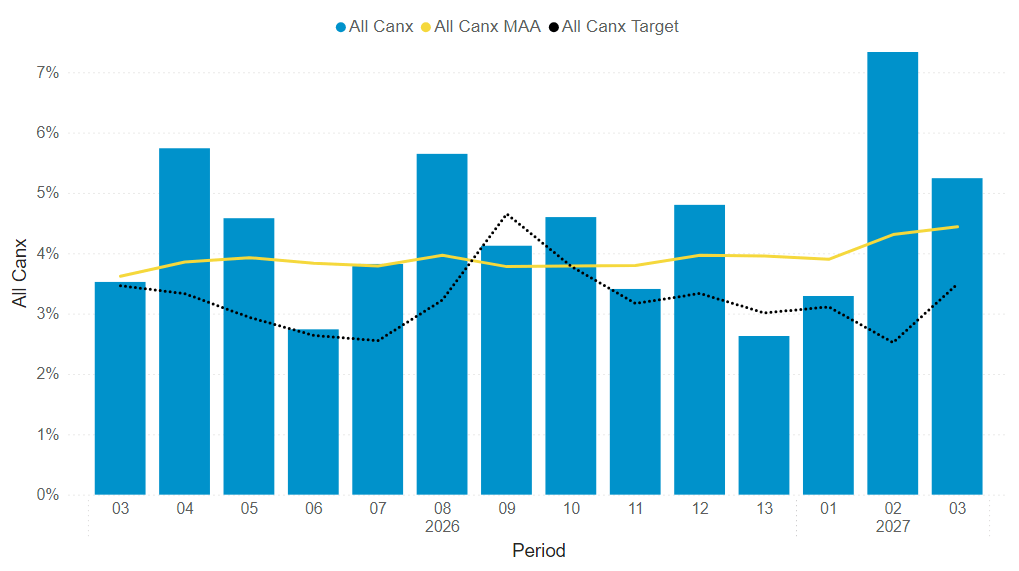
P02 was a challenging period for performance, with both cancellations and punctuality metrics falling below targets. Performance was especially impacted by major performance impacting events and the hot weather.
Major performance impacting events included:
- A GSMR failure on 7th May was the largest single day incident in the last 10 years.
- A points failure at Wimbledon on 11th May impacted the train service significantly in the morning and while the fault was rectified by 0830hrs, the location of the failure meant that the reactionary impact continued throughout the morning peak.
- A tree on the line at Walton-on-Thames on 27th May
- A broken rail at New Malden on 29th May
Hot weather also had a significant impact on our performance and the drop-off in performance between days with a max temperature less than 25 degrees and those with max temperatures over 25 degrees was significant with several track circuit and points failures, alongside the impact of speed restrictions as a result of high rail temperatures.
What we are doing to improve?
- We are investing in improved technologies to provide remote visibility of track conditions (such as on train detection technology), which will help track maintenance teams prioritise tasks and upskilling colleagues to help reduce the time it takes to rectify faults.
- In October we commissioned a state-of-the art signalling system enhancement between Farncombe and Petersfield, which has provided more reliability on one of our busiest long-distance routes
- Upskilling colleagues to help reduce the time it takes to rectify faults
For a more detailed breakdown of performance please click here.