At South Western Railway we know that you want a safe, reliable, punctual service. We’re committed to providing this, to help deliver the best service we can.
We continually measure our service reliability and punctuality and report on how we are performing against targets which are set in our Passenger’s Charter.
All our services are monitored every day, including Sundays and Bank Holidays and we have a range of performance activities taking place to improve our network. Here are a few things we are doing this year:
- Continuing to rollout the Arterio trains to replace the suburban fleet.
- £129m investment in the re-signalling from Farncombe to Petersfield, including the renewal of nine level crossings.
- Queenstown Road Track Renewal to remove multiple reoccurring faults in the area.
Want to know more about what we're doing to improve performance?
Download our Joint Performance Strategy with Network Rail, delivering a high performing railway, together.
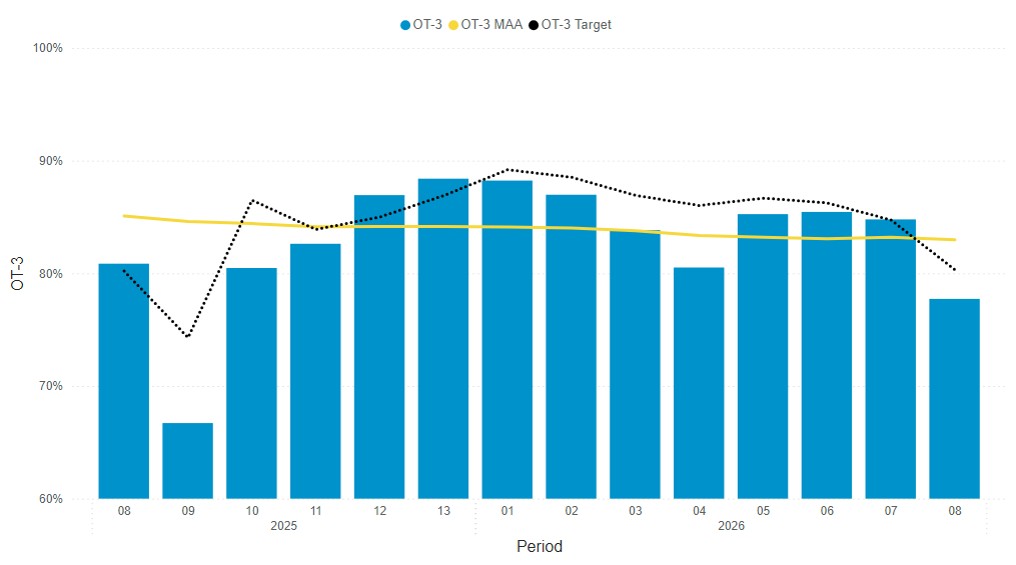
Headline Performance data — Period 8 (12 October - 8 November 2025)
The rail year runs from 1st April to 31st March and is split up into 13 four-week ‘periods'.
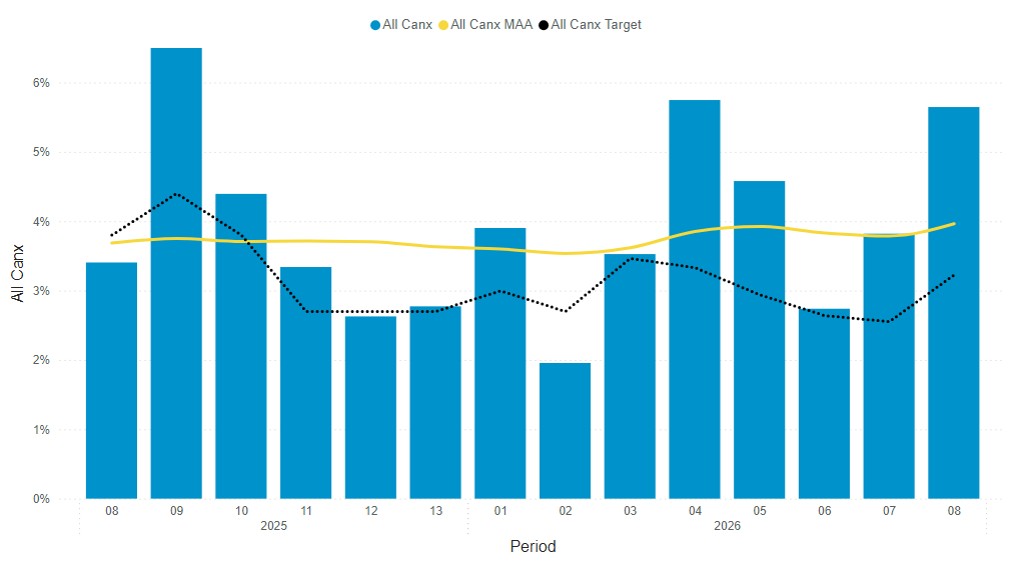
Percentage of total services cancelled
For a more detailed breakdown of performance please click here.
Performance update – period 8
During Period 8 we began to experience the seasonal impact of Autumn on service reliability. Unfortunately, both punctuality and cancellations were affected. Train performance drops during autumn because fallen leaves create a slippery layer on the tracks. When trains pass over wet leaves, they are crushed into a smooth, shiny coating that reduces the grip between wheels and rails, like black ice on roads. This makes it harder for trains to accelerate and brake safely, so drivers must slow down and allow more time for stopping. The slippery rails can also cause wheel damage, leading to further delays and cancellations. We work together with Network Rail to manage this by cleaning tracks, adjusting timetables, and using special treatment trains, but the seasonal conditions make services less reliable.
Additionally, four of our ten most significant incidents were the result of fatalities or trespass, and these alone accounted for 15% of all cancellations in the period.
However, a signal failure at Clapham Junction was the single most disruptive incident, responsible for 7% of all cancellations in the period.
Over the October half term, we also faced challenges with traincrew availability, as we continue to train colleagues on the new Arterio fleet.
The combination of these incidents and the wider Autumn conditions as mentioned above unfortunately meant that we were unable to meet our period 8 targets for cancellations or our on time to 3 performance measure.
What we’re doing about it
Together, as an integrated railway, we are working on a number of measures to improve performance, which include:
Track and signalling
- Using drones to detect cable failures in the London Waterloo area, and conducting trials for targeted on-site inspections, to prevent signalling and track failures respectively
- In October we commissioned a state-of-the art signalling system enhancement between Farncombe and Petersfield, which has provided more reliability on one of our busiest long-distance routes
- Installing guards for axle counters, which tell signallers where trains are on our network, at high-risk locations to prevent lineside litter that could affect signalling systems
Use of new technology, fleet and investing in our colleagues
- We’re introducing Arterio, our new fleet of 90 trains that will transform every single journey on our suburban network.
- We continue to increase the number of fully trained drivers to reduce traincrew related cancellations and delays with over a hundred trainee drivers beginning training this year.
- Investing in improved technologies to provide remote visibility of track conditions, which will help track maintenance teams prioritise tasks
- Upskilling colleagues to help reduce the time it takes to rectify faults
- Using track geometry technology to assess track conditions
- Working on train detection technology for asset failure detection
Trespass and fatality mitigations
- Continuing our engagement with the British Transport Police, the Samaritans, local authorities and other organisations to mitigate trespass and fatalities
- Commencing work on high-risk boundaries and platform ends, following a survey of 203 stations, to help prevent unauthorised access to the railway
- Deploying additional colleagues at key locations, both on trains and at stations, to further prevent unauthorised access to the railway
Managing weather conditions
- Closely monitoring soil moisture levels between Salisbury and Exeter St Davids, helping us plan track maintenance that will remove temporary speed restrictions with re-introduction of the full timetable from Saturday 29 November
- Enacting robust plans for Autumn delivery including additional rail head treatment trains, vegetation clearance, small timetable modifications, additional driving briefings and on the day interventions to improve punctuality for our customers